Autor: Nino Krvavica i suradnici
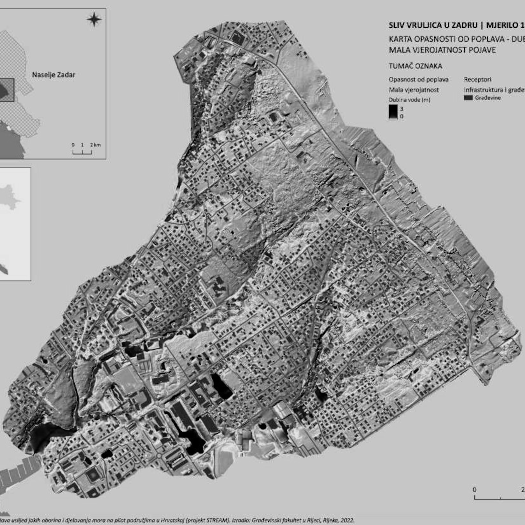
This picture shows a map of the town of Zadar and the depth of water that can occur during floods caused by extreme rainfall. The water is shown in different shades depending on the depth. The base of the map is a detailed digital terrain model obtained by LiDAR technology. Gray color shows all roads and buildings in the area. The map was created on the basis of a mathematical model that simulates the surface runoff of precipitation. This map is the result of the international project STREAM (Strategic Development of Flood Management) which deals with the strategic development of flood management in Italy and Croatia.